Time-Series Analytics Needed? Create an Azure Data Explorer Cluster
Sensors generate readings all day. An operations team needs to search their history and see when temperatures increased. Azure Data Explorer (ADX) stores and indexes telemetry for fast analysis using Kusto Query Language (KQL). Time-series data means measurements associated with timestamps; this lab calculates temperature averages for each minute.
When to Use Each Service
Use Azure Data Explorer to explore large volumes of logs, telemetry, or timestamped events and investigate what happened over time.
| Service | Use it when you need to… | Example |
|---|---|---|
| Data Factory | Move and transform data through coordinated workflows | Copy daily sales files into a reporting database |
| Stream Analytics | Continuously evaluate events as they arrive | Detect incoming temperatures above 30°C |
| Synapse Analytics | Analyze business datasets using SQL, Spark, and pipelines | Combine sales, customers, and inventory for reporting |
| Azure Data Explorer | Store and rapidly query detailed event history using KQL | Find which sensors overheated yesterday and compare their minute-by-minute readings |
Stream Analytics processes the incoming stream; Data Explorer lets you investigate the accumulated history. Data Explorer also supports continuous ingestion and near-real-time queries.
Synapse and Data Explorer overlap in analytics: Synapse suits broader data warehouse and data lake workloads; Data Explorer specializes in interactive analysis of logs and telemetry.
Create the Cluster and Database
In Azure Portal, open Azure Data Explorer Clusters → Create:
Resource group: rg-cloudtrips-adx-test-weu
Cluster name: adxctappweu
Region: West Europe
Workload: Dev/Test
Compute: Dev(No SLA)_Standard_E2a_v4, if available
Public network access: Enabled
Choose the smallest offered Dev/Test size if that size is unavailable, and review its price. Adjust the cluster name if taken. Create the cluster and wait for deployment to finish; provisioning can take around ten minutes.
Open Overview → Create database:
Database name: telemetry
Retention period: 7 days
Cache period: 1 day
Retention controls how long ingested data remains available. The cache keeps recent data on faster storage for queries; older retained data remains queryable.
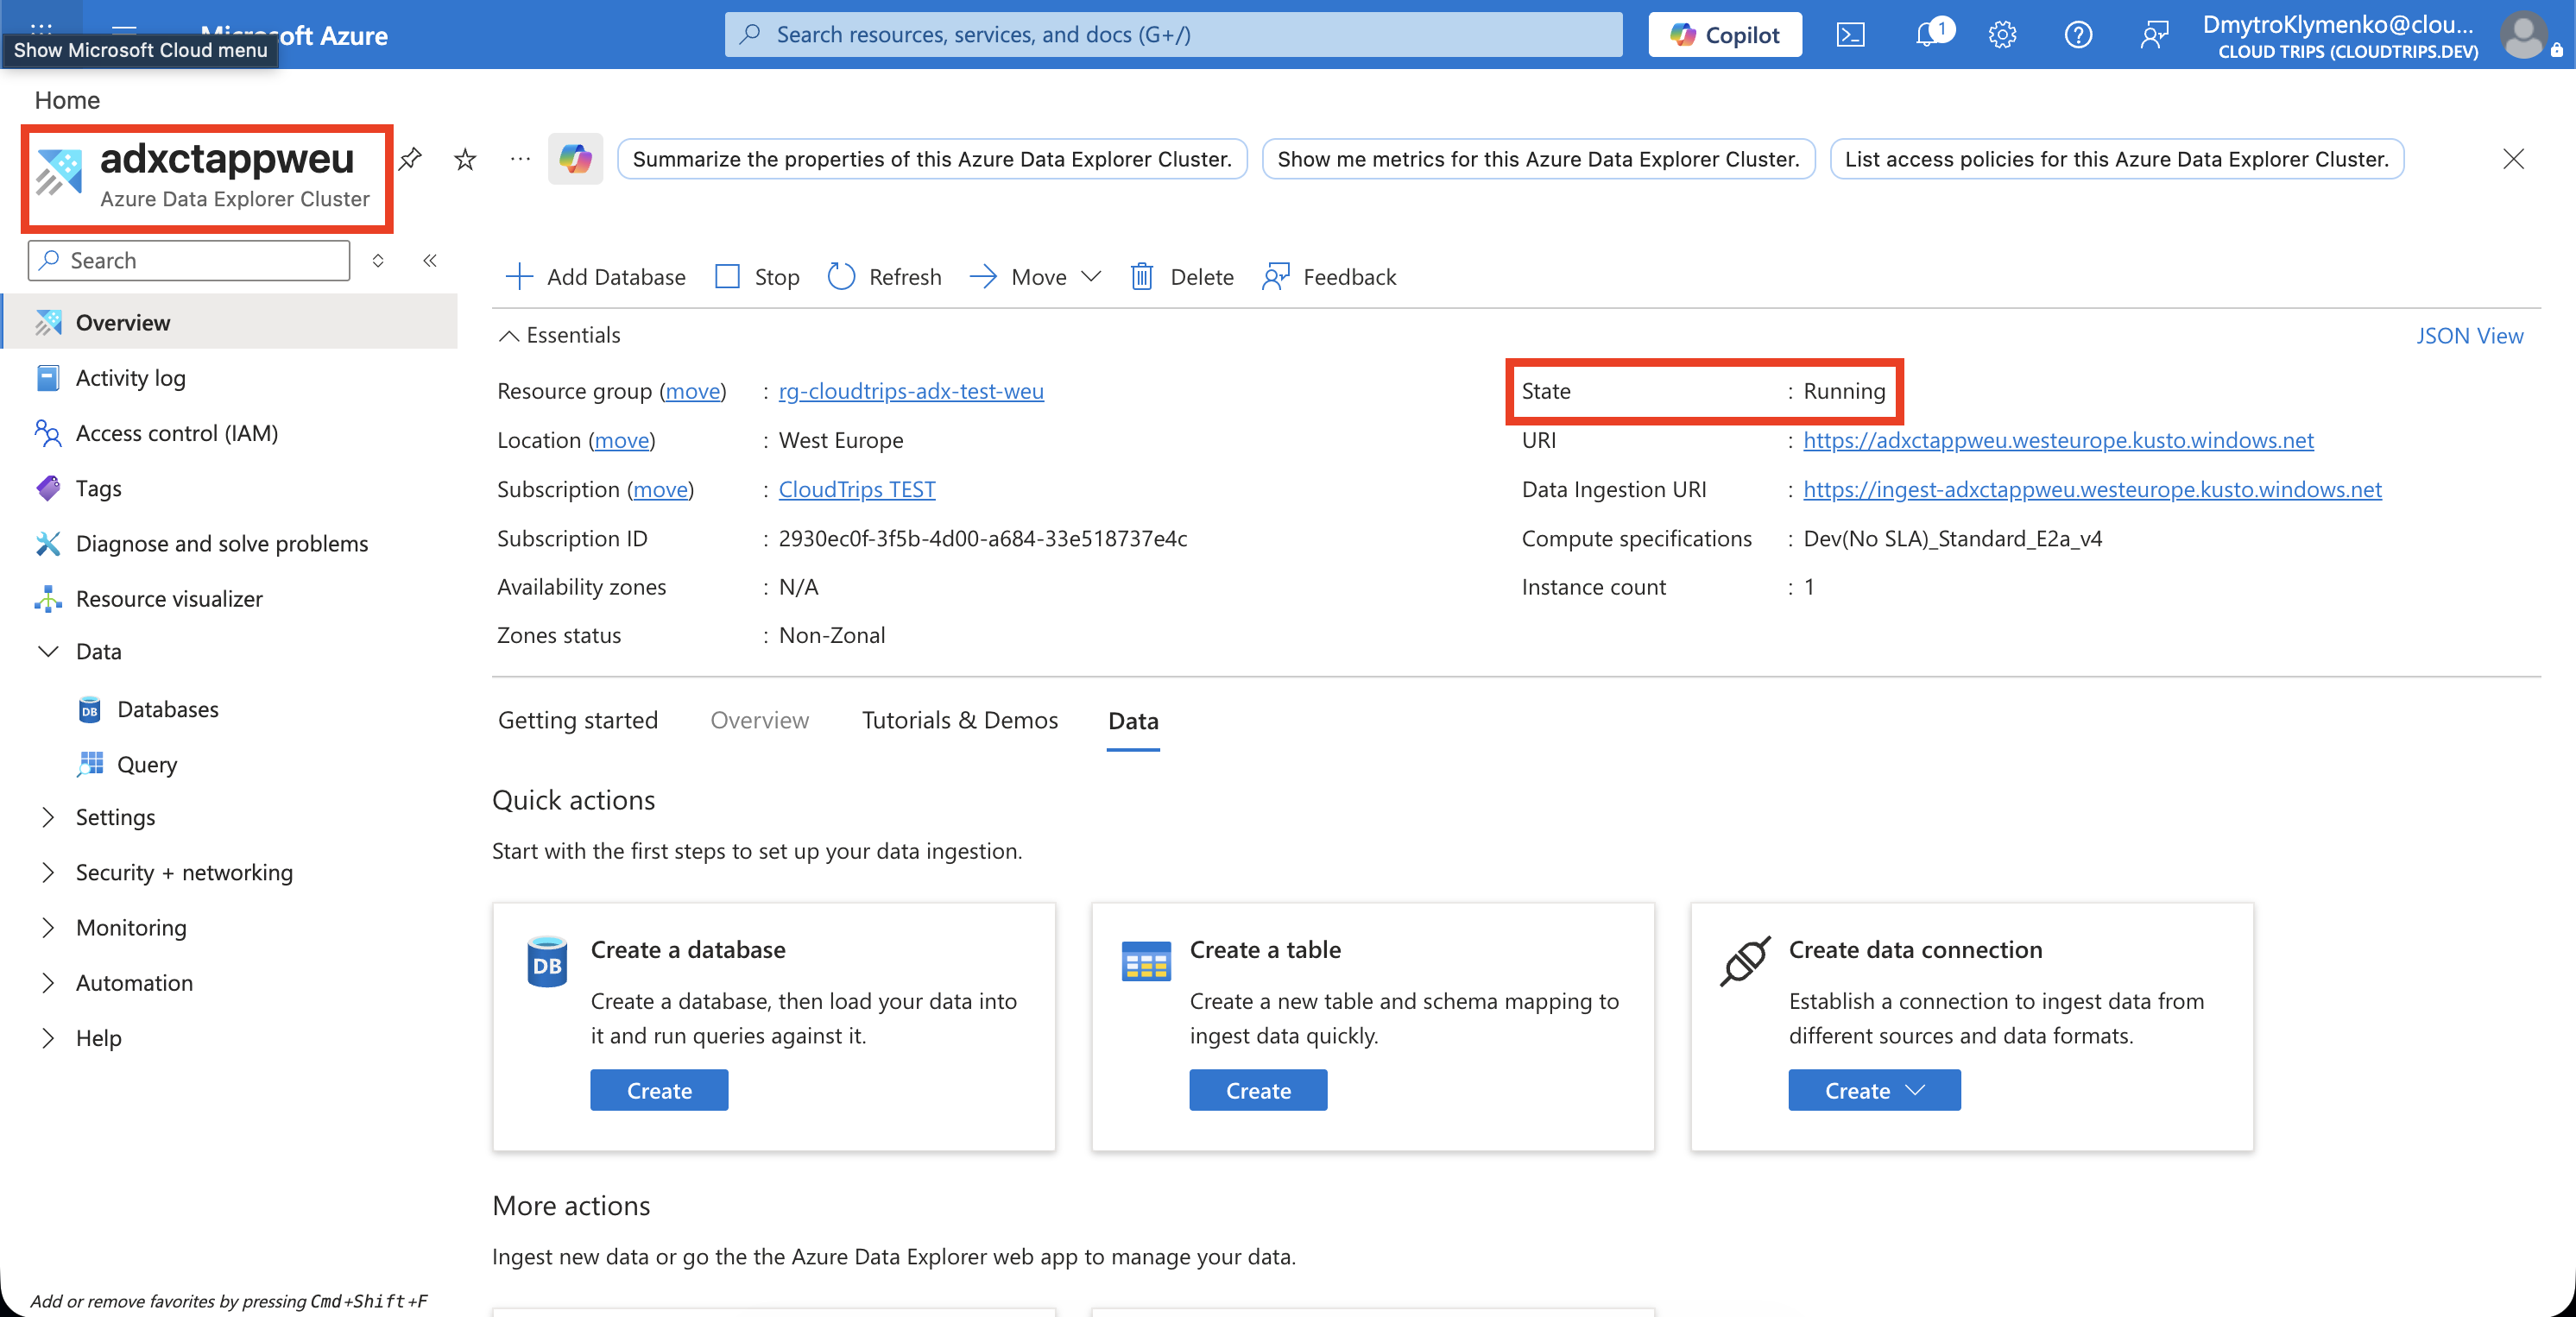
Check that the cluster is Running and telemetry exists. A cluster supplies compute and storage for its databases.
Load Four Readings
Save this plain-text file as temperatures.csv:
timestamp,deviceId,temperature
2026-09-29T10:00:00Z,sensor-1,22
2026-09-29T10:00:30Z,sensor-1,24
2026-09-29T10:01:00Z,sensor-1,35
2026-09-29T10:01:30Z,sensor-1,37
The Z suffix indicates UTC. These fixed timestamps make the query result repeatable; retention starts from ingestion, so this sample can also be used later.
Open the cluster’s Query page or its web UI. If prompted to add a connection, use the cluster URI from Overview. Select telemetry, then Get data → Local file. Create table TemperatureReadings, upload the file, and continue to Inspect.
Select CSV, enable the first-row-as-column-names/header option, and check these columns:
| Column | Type |
|---|---|
| timestamp | datetime |
| deviceId | string |
| temperature | real |
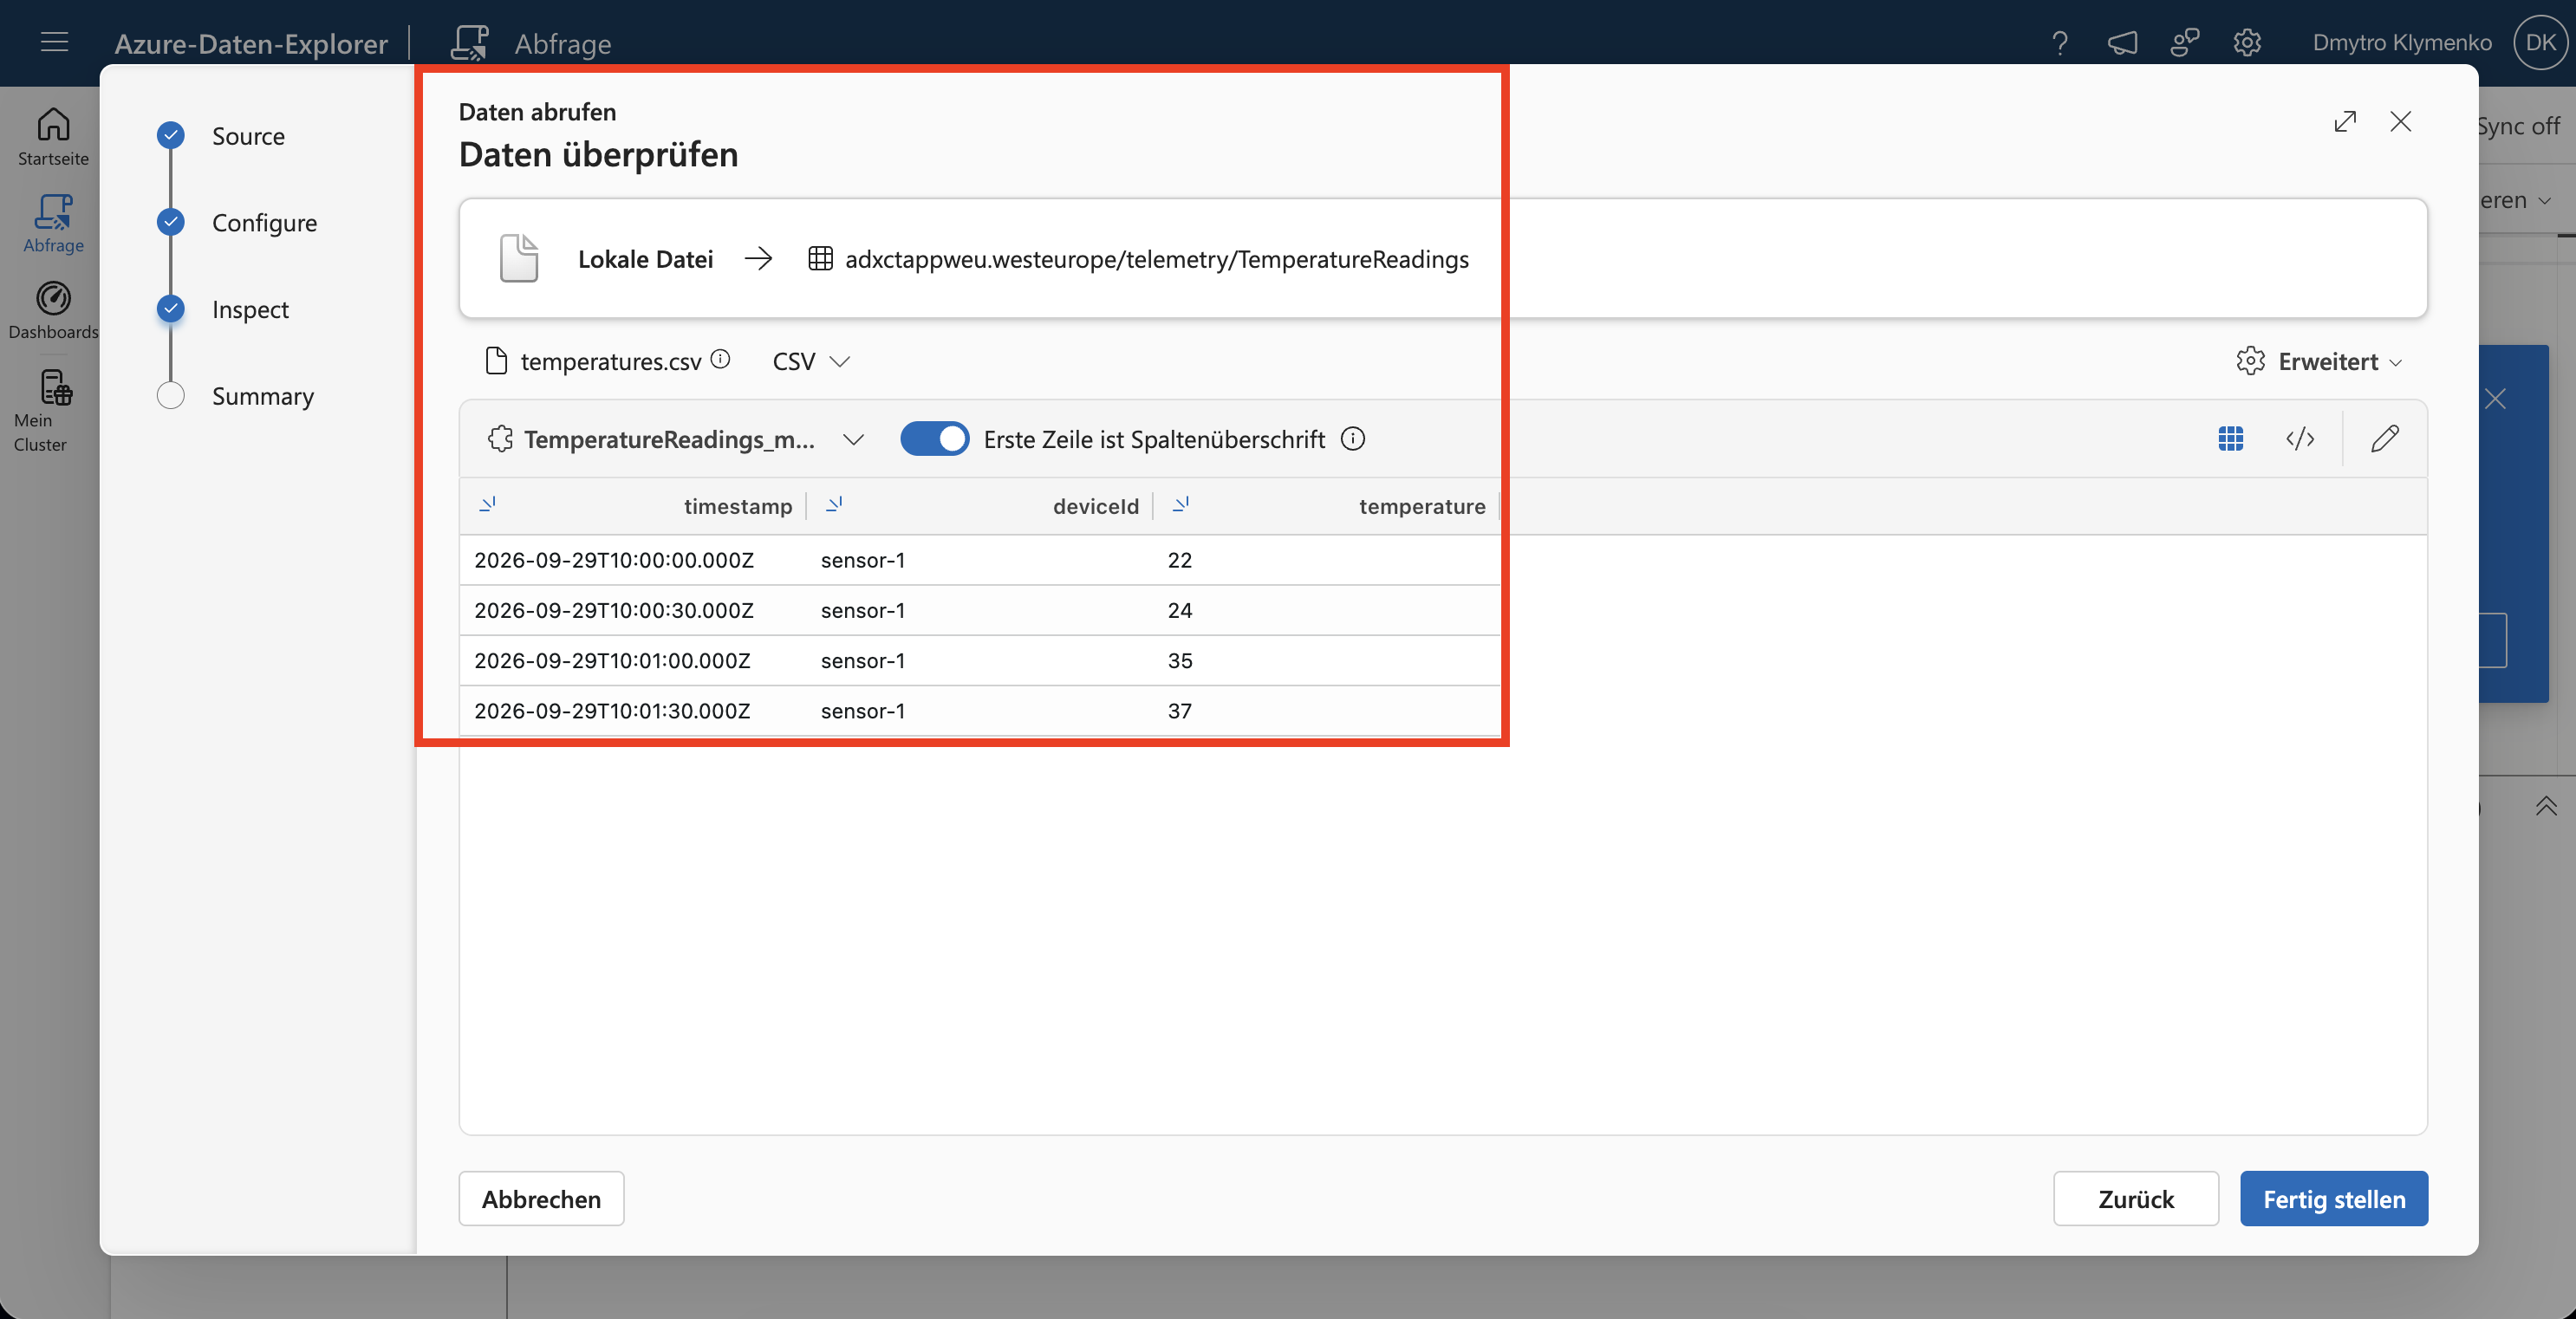
Confirm all four records appear and the header supplies column names. Select Finish and wait for ingestion to complete. Upload once so the sample contains four records.
Calculate Minute-by-Minute Averages
Select database telemetry in the query editor and run:
TemperatureReadings
| summarize AverageTemperature = avg(temperature),
            Readings = count()
    by bin(timestamp, 1m)
| order by timestamp asc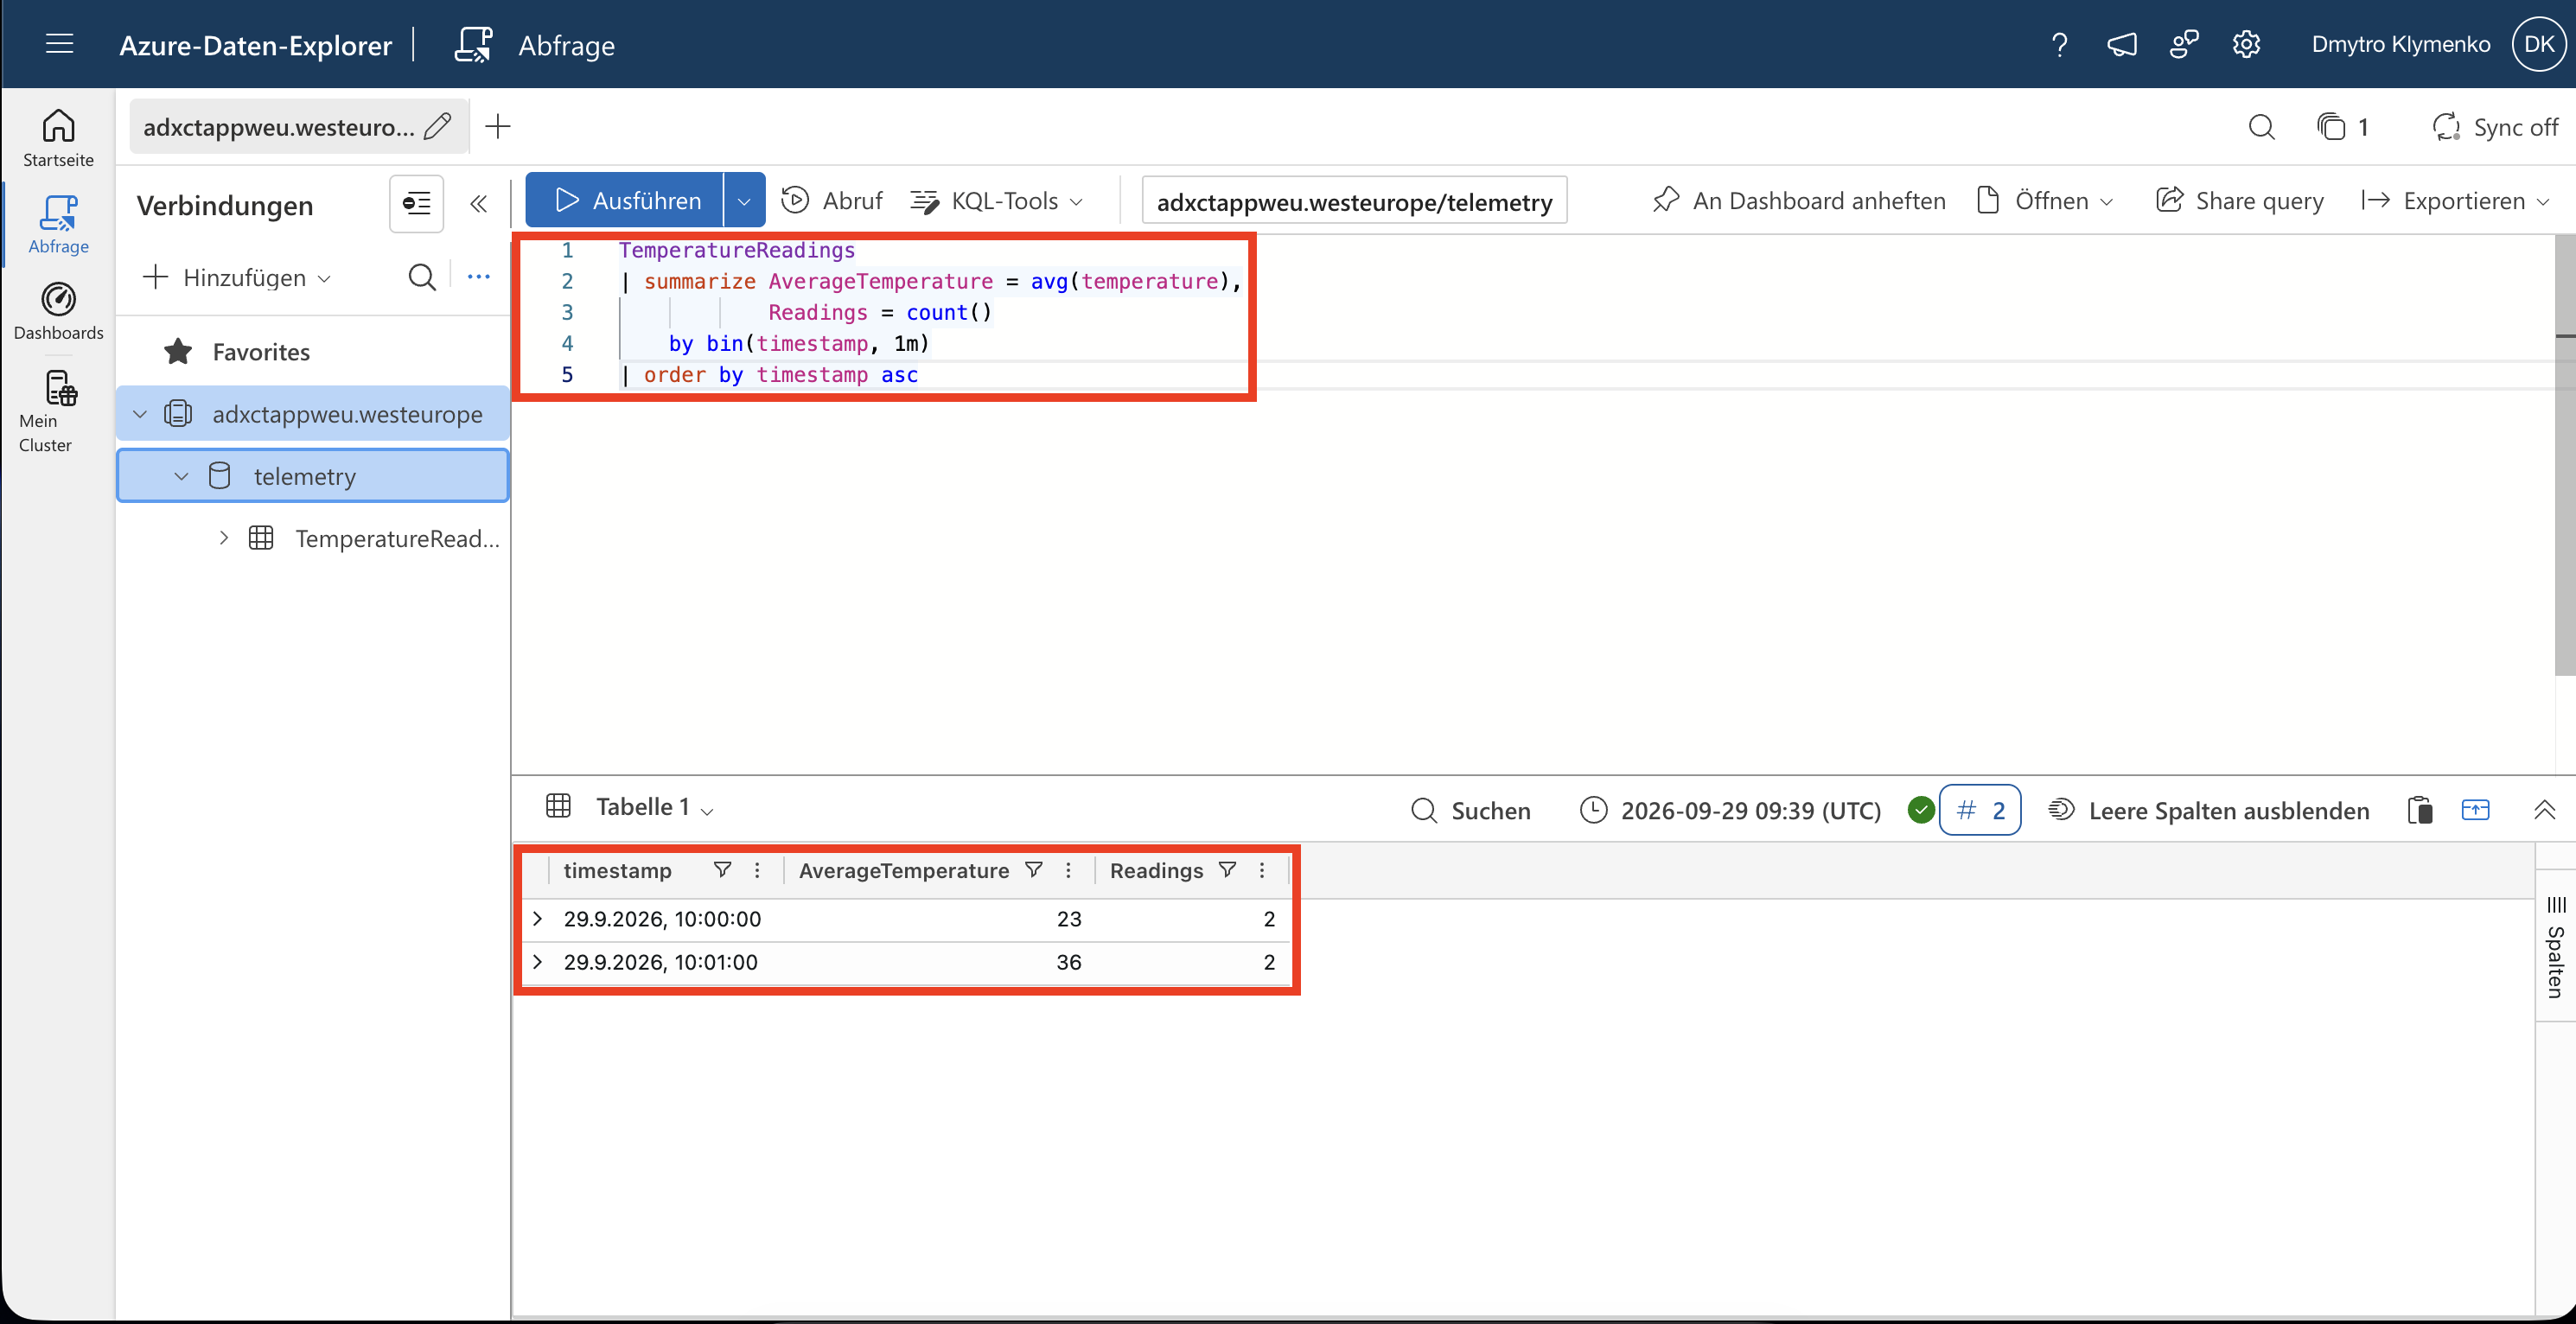
Expect 10:00 UTC → 23°C, 2 readings and 10:01 UTC → 36°C, 2 readings. Each pipe passes results to the next operation. bin(timestamp, 1m) groups timestamps into minute intervals; summarize calculates each average and count. The second interval shows the rise in temperature.
Run this query to chart the average temperature:
TemperatureReadings
| summarize AverageTemperature = avg(temperature)
    by bin(timestamp, 1m)
| order by timestamp asc
| render timechart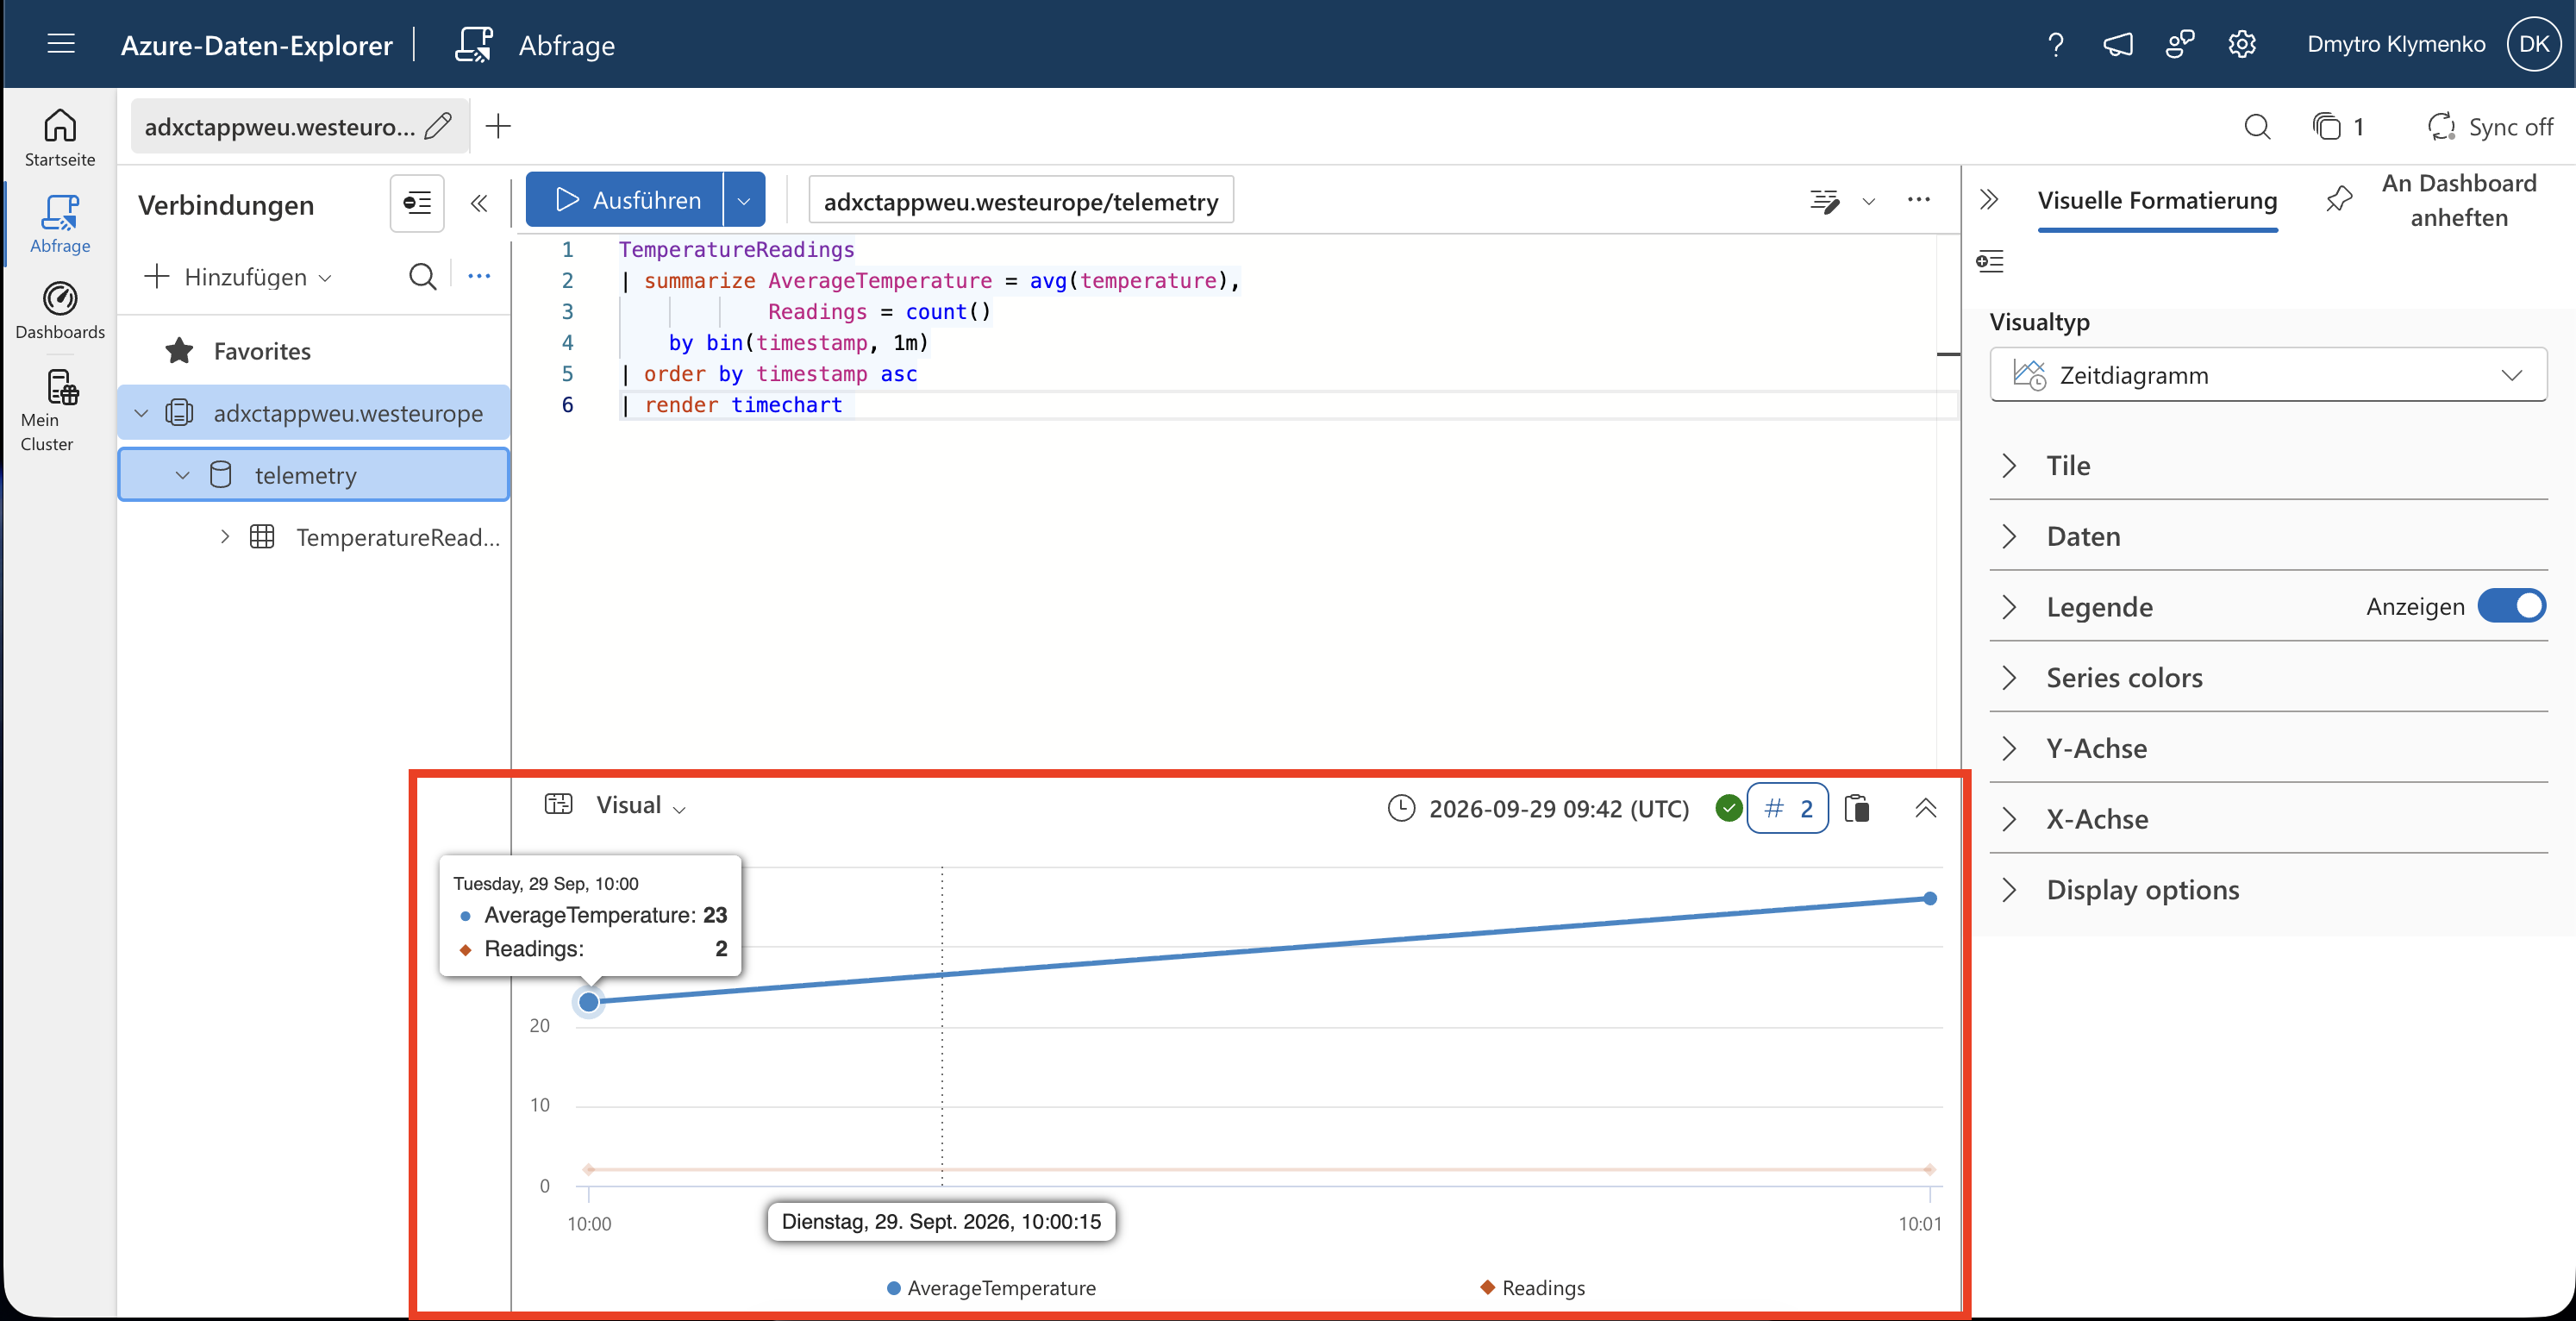
Check the time axis and the average-temperature values: 23°C at 10:00 UTC and 36°C at 10:01 UTC. The rising line makes the temperature increase visible.
This lab uploads a file; continuous ingestion can receive new readings through an Event Hubs data connection.
Finish
Select Stop on the cluster’s Overview page when idle. Compute charges stop while retained storage continues to cost; querying and ingestion resume after restarting. Delete rg-cloudtrips-adx-test-weu when finished to remove the cluster and sample data.