Cosmos Data Needs Analytics? Analyze Cosmos Data with SQL Queries
A shop owner wants to know how many products exist and how prices differ between categories. Reading each document manually becomes slow as the catalog grows. Cosmos DB SQL queries calculate summaries directly from JSON documents in Data Explorer, using the existing container’s throughput.
Use cosmos-ctappeus → Data Explorer → appdb → products from the account creation trip. This lab runs entirely in Azure Portal.
Add Two Sample Products
Open Items → New Item, paste the first document, and select Save. Repeat for the second document:
{"id":"analytics-pen","category":"stationery","name":"Pen","price":2,"lab":"analytics"}{"id":"analytics-mug","category":"home","name":"Mug","price":8,"lab":"analytics"}The lab field isolates these samples from your existing products. If these IDs already exist in their categories, edit those items to match the values above.
Select products → New SQL Query and execute:
SELECT c.id, c.category, c.name, c.price
FROM c
WHERE c.lab = 'analytics'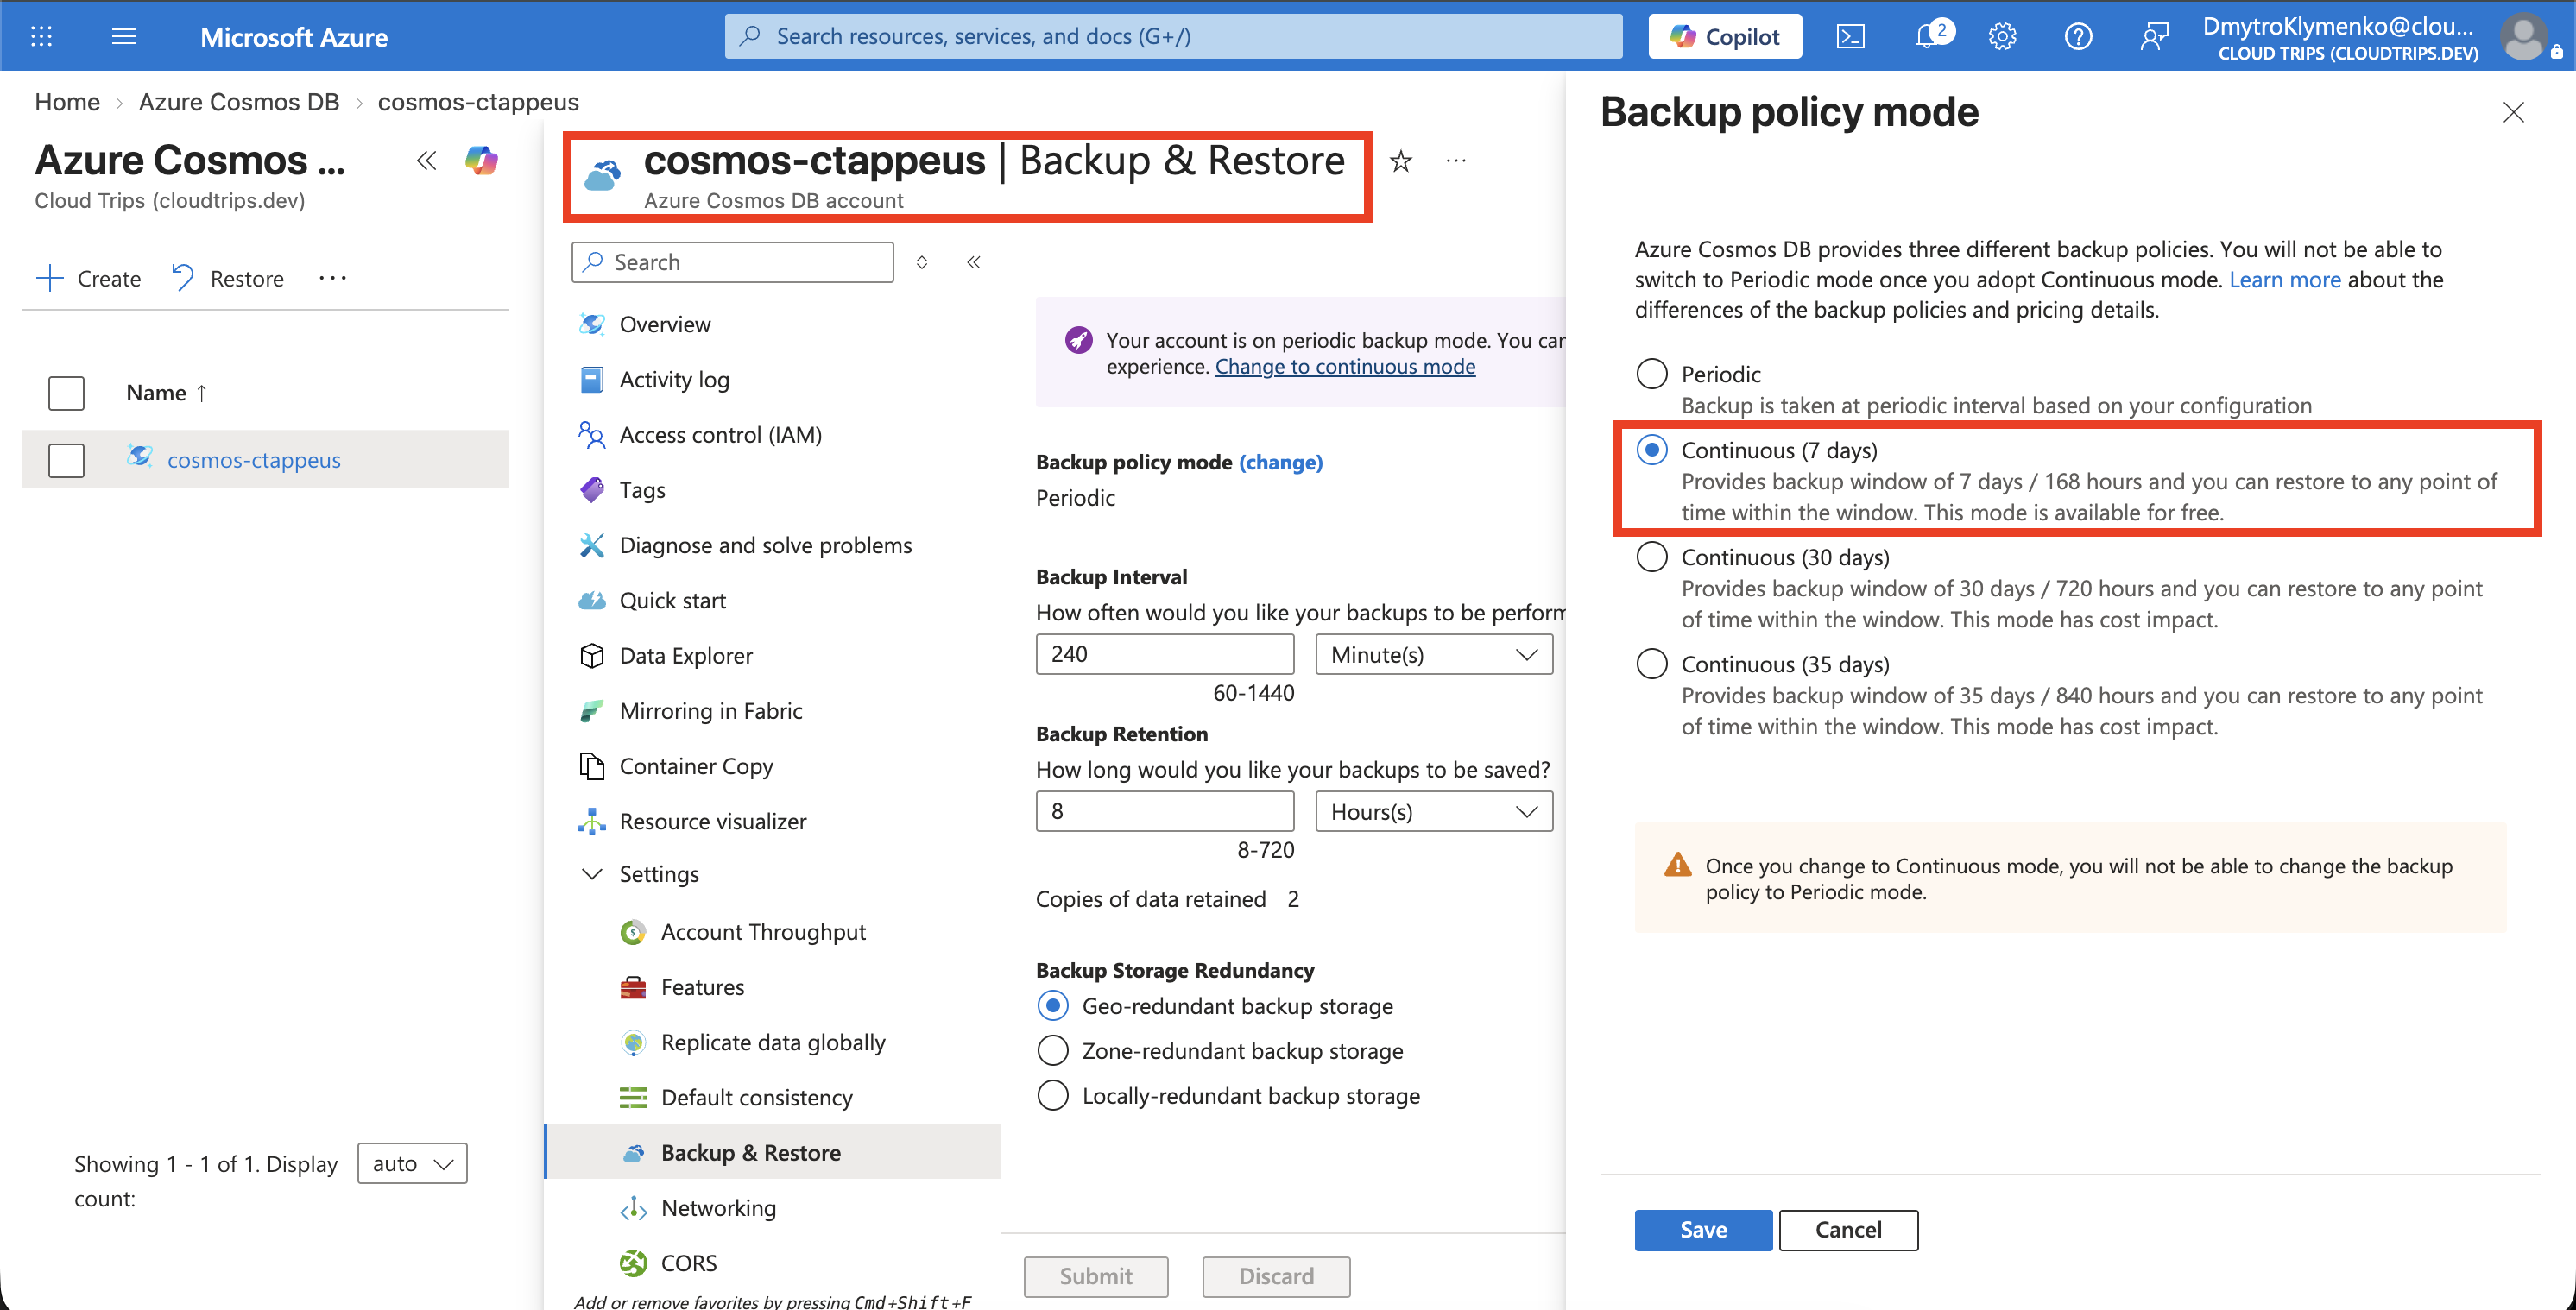
Check both items appear with their category and numeric price. The /category partition key places them in different logical partitions.
Calculate a Summary
In the same query tab, run:
SELECT COUNT(1) AS productCount,
       AVG(c.price) AS averagePrice,
       MIN(c.price) AS lowestPrice,
       MAX(c.price) AS highestPrice
FROM c
WHERE c.lab = 'analytics'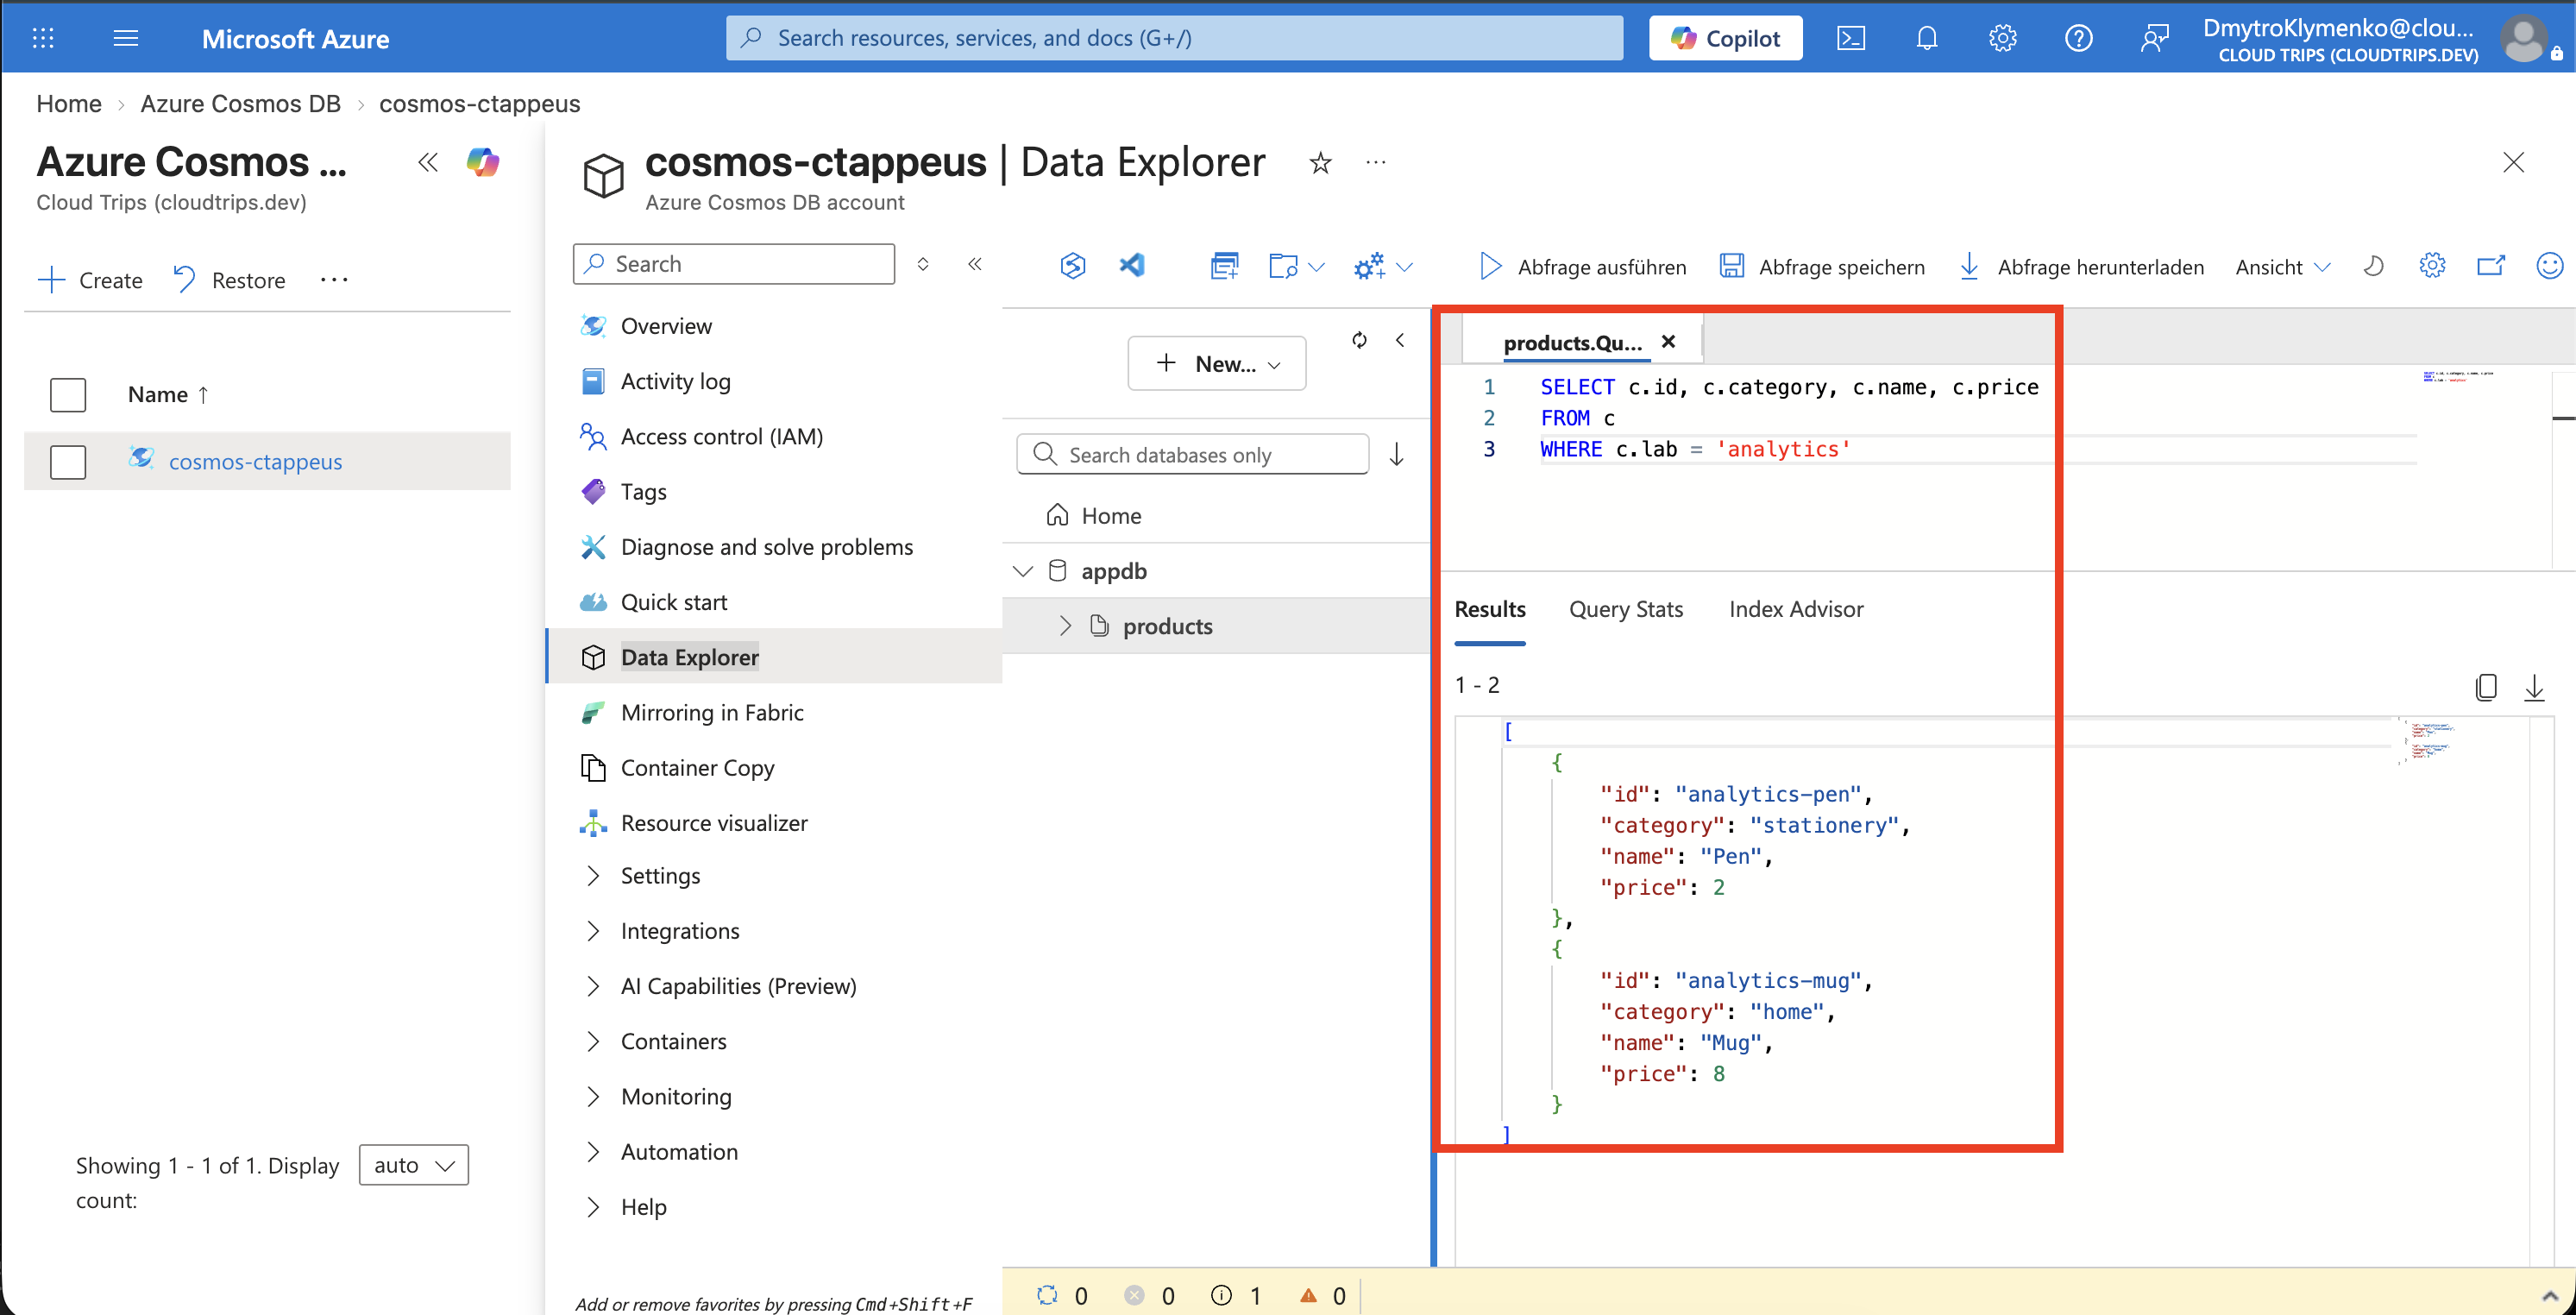
Expect 2 products, average 5, minimum 2, and maximum 8. These functions aggregate matching documents into one result. Check the query’s Request Charge in its statistics: Request Units (RU) measure the database work consumed by this query; the actual charge varies.
Compare Categories
Run:
SELECT c.category,
       COUNT(1) AS productCount,
       AVG(c.price) AS averagePrice
FROM c
WHERE c.lab = 'analytics'
GROUP BY c.category
Expect stationery: 1 product, average 2 and home: 1 product, average 8, in either order. GROUP BY computes a separate summary for each category.
These queries read live Cosmos data and share throughput with application requests. Broad scans across many partitions can consume more RUs; large recurring reports benefit from a separate analytics copy.
Clean Up
Under Items, delete only analytics-pen in stationery and analytics-mug in home. Keep your original products and account for the next trip.